![]()
PRTG all-in-one website monitoring

PRTG monitors
availability
PRTG monitors
load times
PRTG monitors
processes
Built-in alarm
feature
Reporting system for
long-term analysis
Website monitoring with PRTG
Jump to the topic of your choice
- Keep a constant eye on the following three website parameters with PRTG
- Are you ready to move to the cloud?
- Website monitoring: Advantages of PRTG
- Setting up PRTG in 5 easy steps
- 3 website monitoring questions from our knowledge base
- 4 tips for improving the load times of your website
- PRTG: An inside perspective
Keep a constant eye on the following 3 website parameters with PRTG
![]()
Worldwide availability
Use PRTG to monitor the availability of your website, around the clock, 365 days per year. To do so, take advantage of our HTTP v2 Sensor and the HTTP Advanced Sensor. International companies can monitor availability from a variety of locations or across several continents. These companies will want to use our Cloud HTTP v2 Sensor and Cloud Ping v2 Sensor.
![]()
Detailed load times
How much time does it take for your website to load? How do load times change over an extended period of time? Monitor these parameters with our HTTP Full Web Page Sensor. This sensor will also allow you to identify the individual elements which are responsible for slow load times – the basis for system optimization.
![]()
Processes and features
Are all website processes running smoothly? What about the online store? Everything should be running properly, from the homepage and shopping cart, all the way to the confirmation page. When it comes to website processes, the HTTP Transaction Sensor lets you monitor a whole series of URLs. PRTG can therefore also be used as a URL monitoring tool.
A sneak peek into website monitoring with PRTG
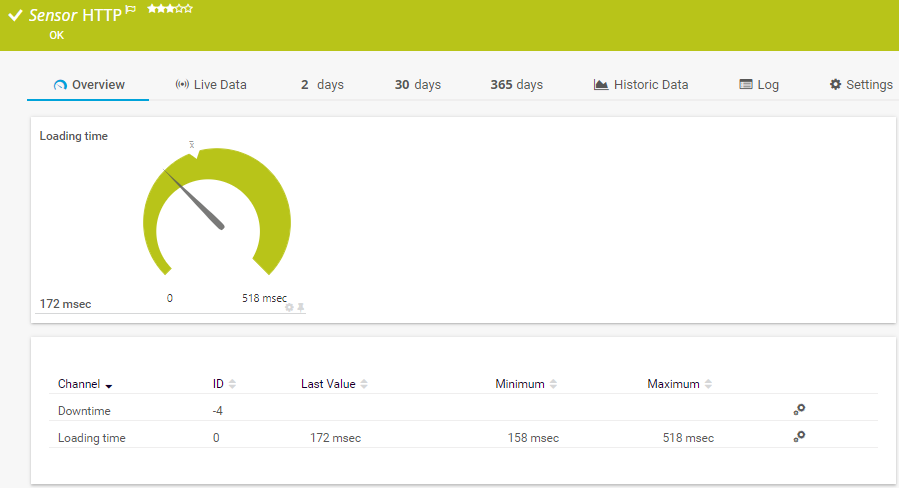
Overview of the PRTG HTTP Sensor
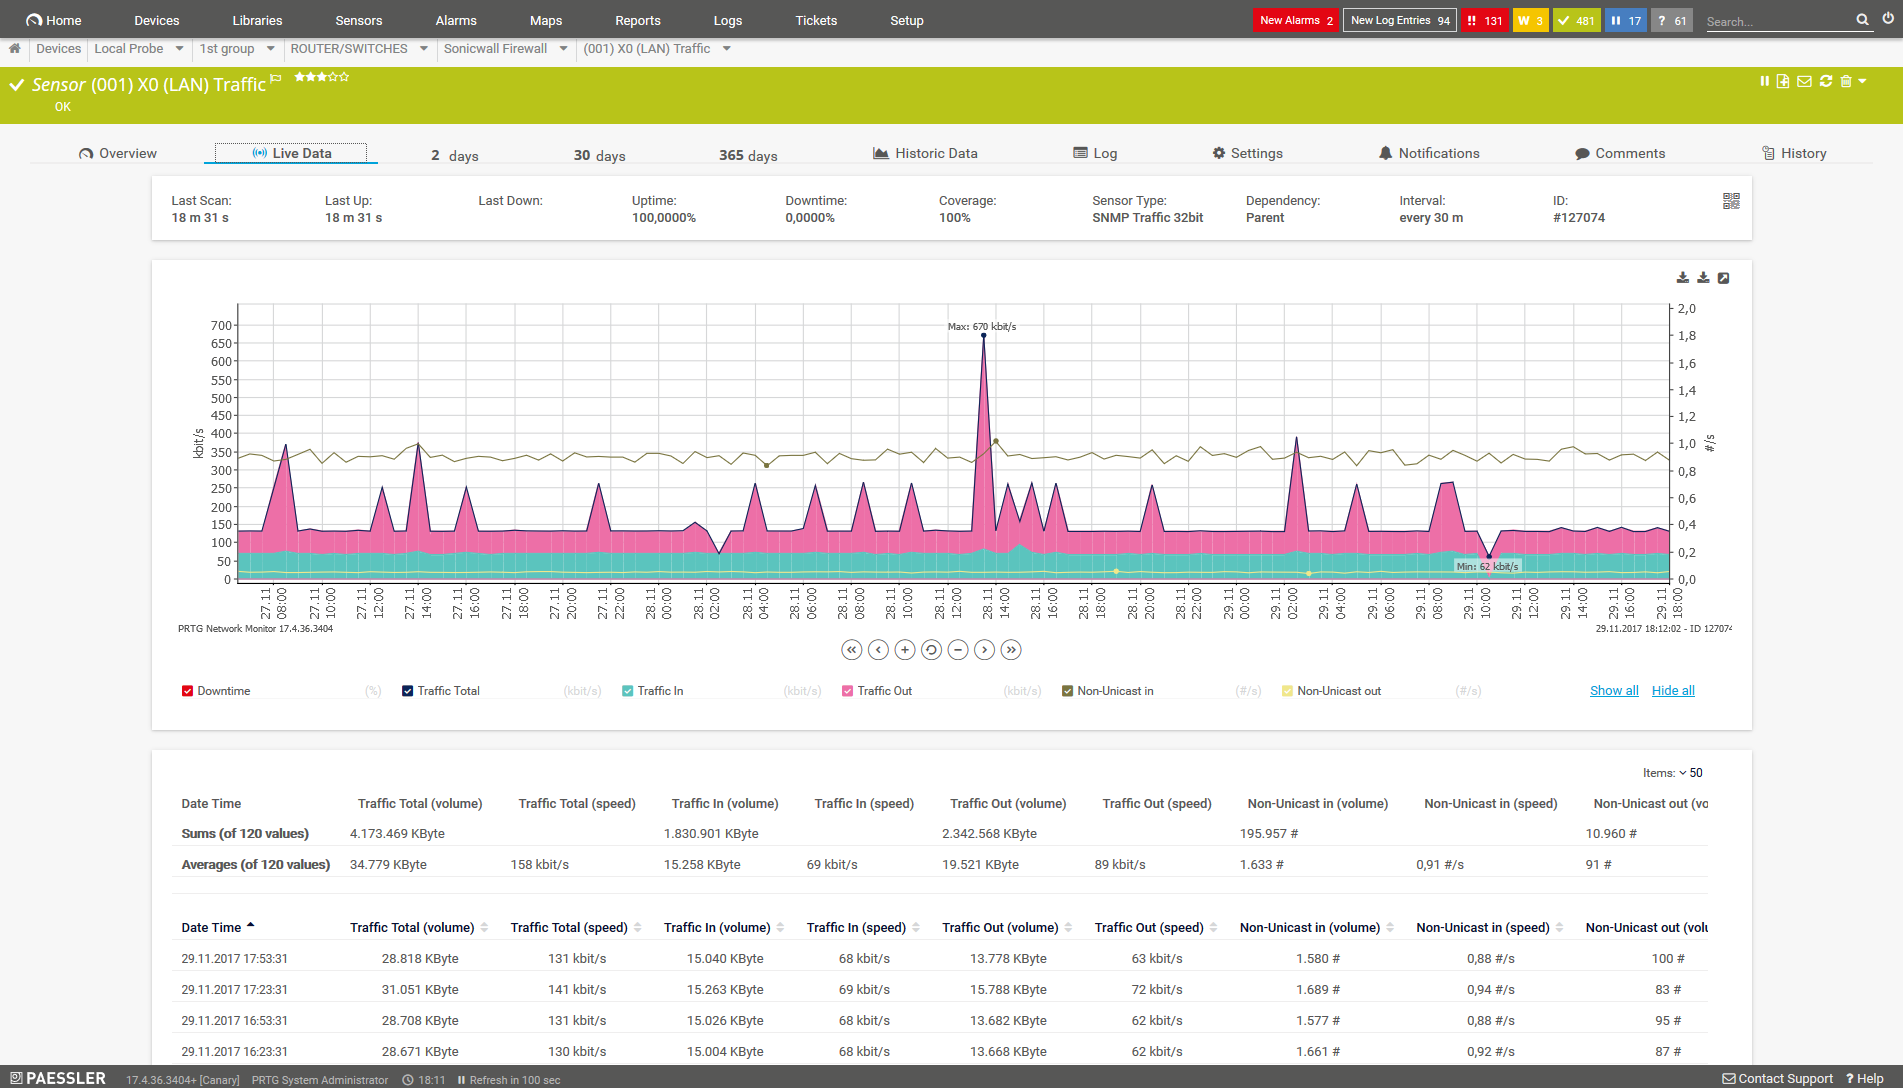
All measurement values are displayed graphically

PRTG Sun
Are you ready to move to the cloud?
![]() Ready-to-use monitoring tool
Ready-to-use monitoring tool
![]() Zero stress through automation
Zero stress through automation
![]() Scale as you grow, pay as you go
Scale as you grow, pay as you go
You want all the qualities of our great monitoring tool PRTG, but without having to maintain the system and manage the hosting yourself?
We're happy to announce the launch of our new cloud solution: PRTG Hosted Monitor, which can be set up in a matter of minutes. You'll benefit from automatic software updates and will be able to scale capacity up or down quickly thanks to our flexible subscription pricing. Ready to dive in yourself?
Website monitoring: Advantages of PRTG
![]()
All-round view
When errors occur on your website, their causes can lie in the most unexpected of places. PRTG shines the flashlight on every nook and cranny: databases, servers, CDN, applications, hardware. You will therefore save considerable time getting to the root of problems and can fix errors faster.
![]()
All-in-one monitoring
With PRTG, all monitoring features, alerts & notifications, reports, apps are included. If you’re looking to set up a small monitoring system for your website, our free version, which comes with 100 sensors, may be all you ever need.
![]()
Custom notification system
PRTG comes with a customizable alarm system. Receive alerts by email, push notification, or SMS. Configure the alarm so you are only notified when absolutely necessary. With the time that is freed up, you can calmly go about the rest of your tasks.
![]()
Long-term monitoring
Custom reports enable you to document the availability and load times of your website automatically – even over longer periods of time. You can show these reports to your higher-ups when you need to invest in your IT infrastructure to obtain high availability and optimal load times for your website, for example.
![]()
Free mobile apps
Do you travel a lot for work? No problem! PRTG is also available as an app for smartphones and tablets, which means you can access our network monitoring tool from wherever you happen to be. The PRTG dashboard offers a quick, compact overview of your system.
![]()
Hassle-free trial
Test the trial version of PRTG for free. It takes just two minutes to configure PRTG. Use the trial to get a detailed look at our software, and to help you make a decision. Our customer support will be happy to answer your questions.
Your website monitoring at a glance – even on the go
Set up PRTG in minutes and use it on almost any mobile device.


Setting up PRTG in 5 easy steps
![]() How PRTG defines sensors
How PRTG defines sensors
In PRTG, “sensors” are the basic monitoring elements. One sensor usually monitors one measured value in your network, e.g. the traffic of a switch port, the CPU load of a server, the free space of a disk drive. On average you need about 5-10 sensors per device or one sensor per switch port.
![]()
Configure PRTG
Configure PRTG Network Monitor. Follow the instructions in the configuration wizard. No more than two minutes are required for the configuration. Once you have successfully configured the software, you can now access the PRTG web interface by way of the standard registration page. For new configurations, PRTG automatically opens the Configuration Guru after each login. The Guru will help you set up PRTG by asking you a few questions about your network. You can also skip the Guru and set your preferences manually at a later time.
![]()
Add your web server to PRTG
Add a “device” to PRTG that represents your web server. Each device in your PRTG configuration represents a piece of physical hardware or a virtual element, which you can associate with an IP address or a DNS name. Choose “Devices | Add Device” from the PRTG main menu, then add your web server to an existing group, or first create a new group and add the web server to that one. You can now name your web server and enter its IP address or the DNS name.
![]()
Add the HTTP v2 Sensor to PRTG
Add the device that represents your web server to your first HTTP v2 sensor. Choose “Add a Sensor” from your device’s context menu and follow the instructions in the wizard. To begin with, you can use the HTTP v2 sensor which has been most effective at checking the availability of your website. Next, in the settings of this sensor, specify the address of the site (or the site element) you wish to monitor. You can now see, at a glance, if your website is available and if its load time lies within acceptable limits.
![]()
Expand your web monitoring
In order to obtain an overview of your entire web server, simply add HTTP v2 sensors for each critical URL. Thanks to the ability of PRTG to intelligently replace URLs, you only need the path of the subpage you wish to monitor, and are not required to enter the entire domain part of the address. Additional HTTP v2 sensors provide for more comprehensive website monitoring. You can use them, for example, to check the content of a delivered page or monitor all the processes used by your online store.
![]()
Evaluate and analyze data
Let PRTG collect the performance data of your web server and websites over a certain period of time. The incoming measurements will be saved in the high-performance database of PRTG. This makes the evaluation and analysis of data both simple and uncomplicated. Furthermore, thanks to the graphical representation of your data, you will get a comprehensive overview of your website status.
Trusted by 500,000 users and recognized
by industry analysts as a leader

“Fantastic network and infrastructure monitoring solution that is easy to deploy and easier still to use. Simply the best available.”

“Software is absolutely perfect, Support is superior. Meets all needs and requirements, this is a must have solution if you are needing any form of monitoring.”

“The tool excels at its primary focus of being a unified infrastructure management and network monitoring service.”
www.humebank.com.au
“PRTG lets us constantly work in accordance with the two-man rule. PRTG notifies us immediately if something is wrong in our network. Thanks to PRTG, we can use our time and resources for the things which really demand our attention.”
Brad Mennen, System Administrator at Hume Bank in Australia. Hume Bank uses PRTG to monitor its LANs, WANs, servers, website, applications, and much more. To the case study
3 website monitoring questions from our knowledge base
Question 1: How can I check if the login authentication for a web page works? Find a detailed answer to this question in the following knowledge base article.
Question 2: How can I use the Business Process Sensor for my website back end? Find the answer to this question in this knowledge base article.
Question 3: How can I use the Business Process Sensor to monitor my website front end? Find the answer here.
“Easy to implement and configure with good technical support.”
R. v. S., ICT Manager at Heinen & Hopman Eng BV

Practical tip: “Hey Jochen, what would you tell administrators looking to monitor their websites with PRTG?"
“I am especially fond of the HTTP Content Sensor, for this sensor can monitor all kinds of website information. It lets me test the login of a website, determine the number of website visitors, and on release notes pages, see if a new software version is available.”
Jochen Greger, Senior Systems Engineer at Paessler AG
4 tips for improving the load times of your website
All websites get bulkier over time. It is often a slow process. Meanwhile, users become more and more impatient. It may be high time your website gets into shape. Check out our free Website Performance Ebook for some practical tips. Here are a few examples:
![]()
Change your database server
Many companies use MySQL. But is this server the best fit for your specific needs? What are the other databases that are out there? When researching database servers, be sure to also compare their load times.
![]()
Reduce CPU load
In some instances, your CPU is brought to its knees. This can occur when you have an online store and have just launched a marketing campaign. Be prepared by booking additional cloud space in advance.
![]()
Set up caching
With caching, you will ensure the files and elements of your website do not need to be reloaded each and every time a page is visited. You will therefore substantially reduce load times. With Typo3, caching is often disabled during development. Check with your developer to see if this is the case for your site.
![]()
Reduce the size of images
Each image should be compressed by default. Save all images in a web-friendly format. You can also delete unnecessary metadata to make your website significantly more compact.
Get your free copy of our cloud ebook now.
We asked: would you recommend PRTG?
Over 95% of our customers say yes!
Paessler AG conducted trials in over 600 IT departments worldwide to tune its network monitoring software closer to the needs of sysadmins.
The result of the survey: over 95% of the participants would recommend PRTG – or already have.


Also interesting:
Server Monitoring: PRTG monitors mail servers, web servers, database servers – and much more. Check out our Server Monitoring page to find out how PRTG makes your job easier.
Uptime Monitoring: On our Uptime Monitoring page, we explore the fundamental issues surrounding uptime, and introduce our uptime sensors.
Packet Capture: PRTG analyzes data packets and displays the data packet loss rate. In the event a critical value is exceeded, you’ll automatically receive an alert.
PRTG makes your job easier
Our monitoring software frees you to focus on other tasks by promptly notifying you of potential issues.
![]()
Save effort
PRTG gives you one central monitoring tool for your servers and entire network. Enjoy a quick overview of your whole infrastructure via our dashboard and app.
![]()
Save time
Getting started with PRTG is a breeze. Setting up or switching from another network monitoring tool is easy thanks to the auto-discovery and pre-configured device templates.
![]()
Save money
80% of our customers report substantial cost savings with network monitoring. Your costs of licenses will likely pay for themselves within weeks.

PRTG: An inside perspective
PAESSLER AG is located in the city of Nuremberg, in the heart of Germany. From here, we cater to our worldwide community. Of course, we also use PRTG to monitor our own website. In this blog article, our founder Dirk Paessler describes the things which were important to us, and how we proceeded.

PRTG: The multi-tool for sysadmins
Adapt PRTG individually and dynamically to your needs and rely on a strong API:- HTTP API: Access monitoring data and manipulate monitoring objects via HTTP requests
- Custom sensors: Create your own PRTG sensors for customized monitoring
- Custom notifications: Create your own notifications and send action triggers to external systems
- REST Custom sensor: Monitor almost everything that provides data in XML or JSON format
Still not convinced?
![]()
More than 500,000 sysadmins love PRTG
Paessler PRTG is used by companies of all sizes. Sysadmins love PRTG because it makes their job a whole lot easier.
Still not convinced?
![]()
Monitor your entire IT infrastructure
Bandwidth, servers, virtual environments, websites, VoIP services – PRTG keeps an eye on your entire network.
![]()
Try Paessler PRTG for free
Everyone has different monitoring needs. That’s why we let you try PRTG for free. Start now with your trial.
|
PRTG |
Network Monitoring Software - Version 24.2.94.1400 (April 10th, 2024) |
|
Hosting |
Download for Windows and cloud-based version PRTG Hosted Monitor available |
Languages |
English, German, Spanish, French, Portuguese, Dutch, Russian, Japanese, and Simplified Chinese |
Pricing |
Up to 100 sensors for free (Price List) |
Unified Monitoring |
Network devices, bandwidth, servers, applications, virtual environments, remote systems, IoT, and more |
Supported Vendors & Applications |
|
Combining the broad monitoring feature set of PRTG with IP Fabric’s automated network assurance creates a new level of network visibility and reliability.